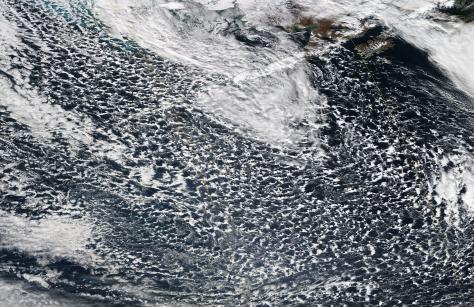
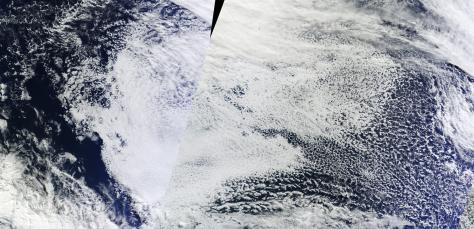
Cold air outbreak over the Aleutians at seen in Worldview, 21st October 2014
Stratocumulus deck out of place
Where in the world is this stratocumulus deck?
The subtropical deck extends 2000 km from east to west, It looks like it should be lying over the southeastern Pacific (SEP), but this deck extends from 130-160 W, where the average daytime stratocumulus cover is 25% (see below), compared with 50% over the SEP.

Cold air outbreak over the North Atlantic (animation)
Here, we can see a cold air outbreak in this GOES-13 animation, using visible (day) and near-IR (night). This particular event shows offshore flow emerging from the NE US and Eastern Canada on the 6th March. The cold air floods over almost the entire North Atlantic region, eventually passing over the Azores (ARM ENA site, 39N, 28W) on the 8th March. The cold air outbreak is mared by open cellular convection in the low clouds. During the time that the cold air outbreak is over the Azores, the concentration of cloud condensation nuclei drops to lower than 50 /cm3, after the precipitation associated with the low clouds removes particles by coalescence scavenging. The event can also be seen on NASA Worldview.
Animation: LES simulations showing ship track sensitivity to background aerosol
This video depicts the albedo field from two LES simulations of a ship track. In the upper panel, the background cloud condensation nuclei concentration is approximately 10-15 /cm3, while in the lower panel, it is 100-150 /cm3. The ship track aerosol perturbation applied to the high background aerosol case is 10x as large as the low background aerosol case in order to make a visible signature, as the weaker perturbation used in the low aerosol case has a much weaker impact under conditions of high background aerosol.
Animation courtesy of Andy Berner
Animation: modeled ship tracks
This video depicts the albedo field from two large eddy simulations (LES) of a ship track. In both cases, background aerosol concentration is 10-15 /cm3. Because the boundary layer in the case modeled is quite shallow (300m) and strongly sheared (wind speed of 20 m/s in downdrafts and 15 m/s in updrafts due to surface drag), the boundary layer organizes into roll cells. This organization results in highly anisotropic bulk turbulent diffusivity of scalars. This can be appreciated by inserting a ship track perturbation aligned with or perpendicular to the roll circulation, and noting that the cloud response is quite different, reflecting the more rapid lateral diffusion of the cloud condensation nuclei when the track is inserted perpendicular to the rolls.
Animation courtesy of Andy Berner
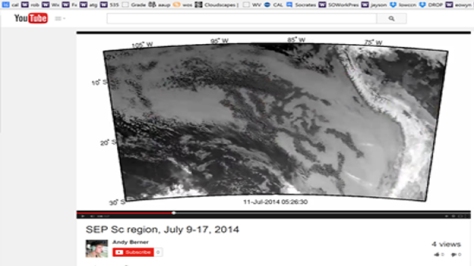
Animation: Actinoform spiral over the SE Pacific
Animation courtesy of Andy Berner
Animation: GOES imagery of West Coast ship tracks, Jan 2013
Animation courtesy of Andy Berner
Animation: ship tracks in marine stratocumulus, December 2013
Animation courtesy of Andy Berner
Geostationary animation of pockets of open cells
This multi-day animation from Andy Berner shows geostationary satellite view of open cells forming in marine stratocumulus over the southeastern Pacific over multiple days.
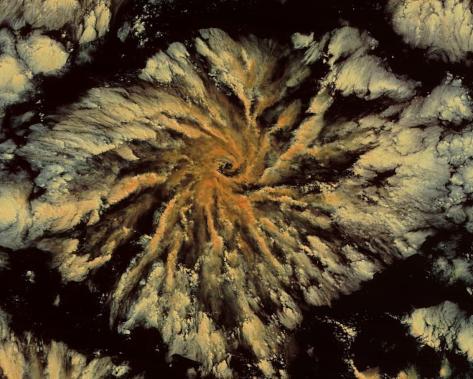
Actinoform structure with eye
This rotating actinoform cloud over the eastern Pacific actually has an eye.


